

1. Project Overview
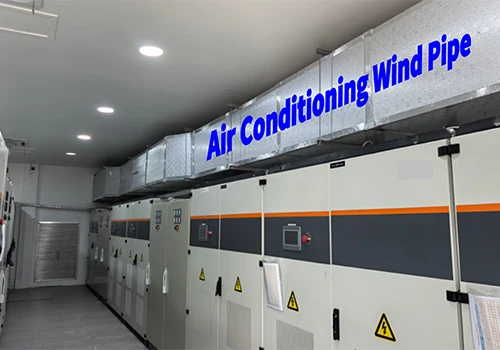
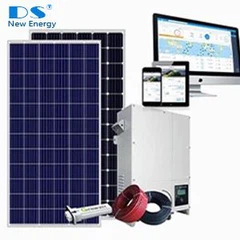
A factory in South Africa has installed one 50 kW commercial air conditioner (rated cooling power 50 kW, heat transfer capacity 65.4 kW, air-cooled condenser, refrigerant R22, airflow 22,000, net weight 150 kg) together with a 74 kW solar PV system and a 50 kW grid-tied inverter (model STT-50KTL-M). This report evaluates the power generation benefits and financial returns of the PV system in three representative South African cities: Johannesburg, Cape Town, and Durban.
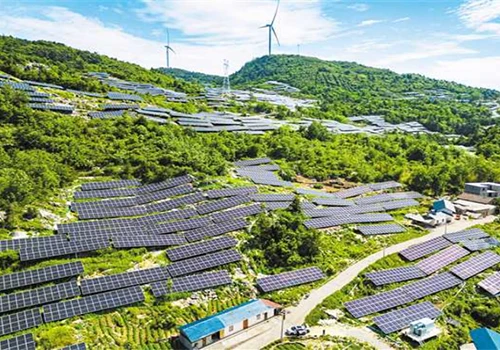
South Africa is known as the "land of sunshine". Most regions receive over 2,500 sunshine hours per year, with average daily solar radiation between 4.5 and 6.5 kWh/m². The country's annual average solar radiation reaches 220 W/m², far higher than the USA (150 W/m²) and Europe (100 W/m²). These outstanding solar resources make South Africa one of the most attractive markets for PV investment worldwide.

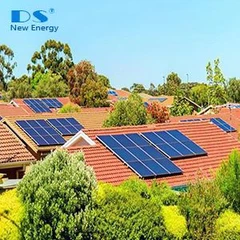
How Does the On-Grid Solar Air Conditioning System Work?
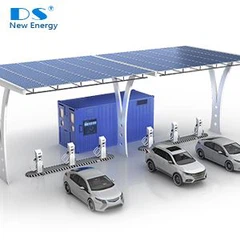
The SolarCool GridPro 50 On-Grid Air Conditioning System prioritizes solar energy during daytime operation. Electricity generated by the solar panels is first used to power the air conditioner, reducing the amount of electricity drawn from the utility grid.
For example, if the air conditioning system requires 50kW of power and the solar array is generating 40kW, the remaining 10kW will be supplied automatically by the utility grid. When solar generation reaches or exceeds the air conditioner's power demand, the system can operate primarily on solar energy.
If solar production is higher than the building's consumption, excess electricity can be exported to the utility grid according to local regulations. At night or during periods of low solar irradiation, the air conditioning system operates seamlessly using grid power, ensuring continuous and reliable cooling performance.
PV System Configuration
| No. | Item | Description | Quantity | Unit |
| 1 | Commercial air conditioner | Rated power:50kW | 1 | pcs |
| Heat transfer Capacity: 65.4KW | ||||
| Air Cooled Condenser | ||||
| Refrigerant:R22 | ||||
| Air Flow:22000 | ||||
| Net Weight:150KG | ||||
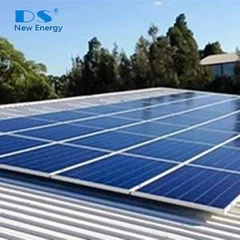
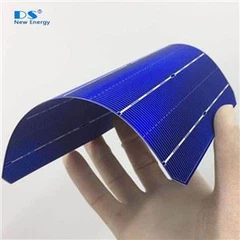
| 2 | Solar panel | Mono 580 W | 360 | pcs |
| 3 | Mounting structure | Mounting structure for solar panel installed on the roof/ground | 1 | set |
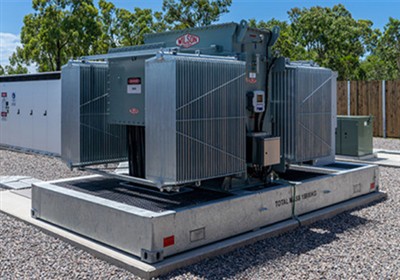
| 4 | Diesel generator | 125KW | 1 | pcs |
| 5 | Hybrid inverter | 125KW | 1 | pcs |
| 6 | Battery | 128KWh | 1 | pcs |
| 7 | Cable | 6mm2 cable, red and black | 1200 | mtr |
| 8 | PV connector | MC4 compatible | 40 | pair |
Key inverter parameters (STT-50KTL-M):
|
Model |
Parameter |
|
Max. input power |
80,000 W |
|
Start-up voltage |
180 V |
|
Max. DC input voltage |
1,100 V |
|
Rated DC input voltage |
620 V |
|
MPPT voltage range |
180 – 1000 V |
|
Number of MPPT trackers |
4 |
|
DC inputs per MPPT |
2 |
|
Max. input current |
26/26/26/26 A |
|
Rated output power |
50,000 W |
Solar Resource Comparison across Three Cities
The three selected cities have distinct solar radiation characteristics:
|
City |
Annual sunshine hours |
Annual solar radiation (kWh/m²) |
Average peak sun hours (daily) |
Features |
|
Johannesburg |
2,500+ |
~2,023 – 2,269 |
~6.2 h |
Stable year-round, dry winters |
|
Cape Town |
2,500+ |
~2,146 |
~5.9 h |
Excellent summer, slightly less in winter |
|
Durban |
2,500+ |
~1,636 – 1,659 |
~4.5 – 4.8 h |
Coastal, more cloudy days, lower radiation |
Johannesburg and Cape Town both receive over 2,000 kWh/m² annually – among the highest in the world. Durban, being subtropical coastal, has more overcast conditions and lower annual radiation (~1,650 kWh/m²).
4. PV Generation Estimates
Based on the 74 kW system, using the NREL PVWatts model and academic field studies (Springer publication for Durban):
|
City |
Annual radiation (kWh/m²) |
Specific yield (kWh/kWp) |
Annual generation (74 kWp) |
Daily average |
|
Johannesburg |
2,269 |
~1,704 |
126,096 kWh |
345 kWh |
|
Cape Town |
2,146 |
1,659 |
122,766 kWh |
336 kWh |
|
Durban |
1,659 |
1,403 |
103,822 kWh |
284 kWh |
Johannesburg offers the highest yield (~126 MWh/year), Cape Town is a close second (~123 MWh/year), while Durban generates about 104 MWh/year due to lower solar radiation.

5. South African Electricity Tariffs
5.1 Current Tariff Level
As of September 2025, the commercial/industrial electricity tariff in South Africa is ZAR 2.289 per kWh (approx. USD 0.139/kWh), according to GlobalPetrolPrices.com.
5.2 Tariff Increase Trends
South African electricity prices have been rising steeply. In 2025, the increase was 12.74%. For 2026, the originally expected 5.4% rise was recalculated due to a miscalculation by NERSA (the energy regulator) – an additional ZAR 76 billion had been omitted, pushing the 2026 increase to an estimated 10.5%.
|
Fiscal Year |
Increase |
Remarks |
|
2025/26 |
12.74% |
Already implemented |
|
2026/27 |
~10.5% |
Effective from April 2026 |
Eskom targets revenues of ZAR 446 billion in FY2026, ZAR 495 billion in FY2027, and ZAR 537 billion in FY2028.
6. Annual Electricity Cost Savings
6.1 At Current Tariff (ZAR 2.29/kWh)
|
City |
Annual generation (kWh) |
Annual savings (ZAR) |
Monthly savings (ZAR) |
|
Johannesburg |
126,096 |
288,760 |
24,063 |
|
Cape Town |
122,766 |
281,134 |
23,428 |
|
Durban |
103,822 |
237,752 |
19,813 |
6.2 Five-Year Cumulative Savings (Accounting for Tariff Increases)
|
Year |
Tariff (ZAR/kWh) |
Johannesburg |
Cape Town |
Durban |
|
Year 1 |
2.29 |
288,760 |
281,134 |
237,752 |
|
Year 2 |
2.53 |
319,023 |
310,598 |
262,670 |
|
Year 3 |
2.80 |
353,069 |
343,745 |
290,702 |
|
Year 4 |
3.08 |
388,376 |
378,119 |
319,772 |
|
Year 5 |
3.39 |
427,465 |
416,177 |
351,957 |
|
Total 5-year |
– |
1,776,693 |
1,729,773 |
1,462,853 |
Five-year cumulative savings: Johannesburg ~ZAR 1.78 million, Cape Town ~ZAR 1.73 million, Durban ~ZAR 1.46 million.
7. Comparison with Air Conditioner Consumption
The 50 kW commercial AC, under typical industrial usage patterns:
|
Usage scenario |
Daily run hours |
Daily consumption (kWh) |
Monthly (kWh) |
Annual (kWh) |
|
Light (seasonal) |
4 h |
200 |
6,000 |
72,000 |
|
Medium (normal) |
8 h |
400 |
12,000 |
144,000 |
|
Heavy (24/7) |
12 h |
600 |
18,000 |
216,000 |
PV coverage of AC consumption (8-hour/day operation):
|
City |
PV annual generation |
Percentage of AC consumption covered |
|
Johannesburg |
126,096 kWh |
~87.6% |
|
Cape Town |
122,766 kWh |
~85.3% |
|
Durban |
103,822 kWh |
~72.1% |
In Johannesburg and Cape Town, the PV system can cover over 85% of the AC's operating electricity; in Durban, coverage is about 72%, so the factory would still need to draw some power from the grid.
8. Core Benefits of Installing the PV System
8.1 Financial Returns
|
Benefit dimension |
Johannesburg |
Cape Town |
Durban |
|
Annual savings (current tariff) |
ZAR 288,760 |
ZAR 281,134 |
ZAR 237,752 |
|
5-year cumulative savings |
ZAR 1.777 M |
ZAR 1.730 M |
ZAR 1.463 M |
|
25-year life-cycle savings* |
~ZAR 8.9–10.7 M |
~ZAR 8.7–10.4 M |
~ZAR 7.3–8.8 M |
|
Estimated payback period |
4–5 years |
4–5 years |
5–6 years |
*Assumes a conservative 5% annual tariff escalation.
8.2 Hedge against Rising Electricity Prices
South African tariffs are rising fast – 12.74% in 2025 and an estimated 10.5% in 2026. Installing solar effectively locks in electricity costs for the next 25 years, shielding the business from continuous tariff hikes.
8.3 Mitigation of Load-Shedding Risks
South Africa has long suffered from grid instability and load-shedding. Eskom plans to increase revenues from ZAR 446 billion to ZAR 537 billion over 2026-2028, and these costs will inevitably be passed on to consumers. On-site solar reduces dependence on the fragile grid and enhances operational continuity.
8.4 Environmental Impact
|
Environmental metric |
Johannesburg |
Cape Town |
Durban |
|
Annual generation (kWh) |
126,096 |
122,766 |
103,822 |
|
CO₂ avoided annually* (kg) |
~88,267 |
~85,936 |
~72,675 |
|
Equivalent trees planted** |
~4,413 |
~4,297 |
~3,634 |
*Assuming South African grid emission factor ~0.7 kg CO₂/kWh.
**Assuming each tree absorbs 20 kg CO₂ per year.
9. Comprehensive Comparison Summary
|
Metric |
Johannesburg |
Cape Town |
Durban |
|
Annual solar radiation |
2,269 kWh/m² |
2,146 kWh/m² |
1,659 kWh/m² |
|
Annual PV generation |
126,096 kWh |
122,766 kWh |
103,822 kWh |
|
Annual savings (current) |
ZAR 288,760 |
ZAR 281,134 |
ZAR 237,752 |
|
5-year cumulative savings |
ZAR 1,776,693 |
ZAR 1,729,773 |
ZAR 1,462,853 |
|
AC coverage (8h/day) |
87.6% |
85.3% |
72.1% |
|
Payback period |
4–5 years |
4–5 years |
5–6 years |
|
Recommendation priority |
★★★★★ |
★★★★★ |
★★★★ |
10. Conclusion
Overall, installing a commercial PV system in South Africa is a highly economically compelling investment. With electricity tariffs rising by over 23% cumulatively in just two years (2025-2026) and ongoing grid uncertainty, solar power delivers not only direct financial savings but also energy independence, environmental compliance, and enhanced brand value for the business.