


Source: https://www.energyprices.eu/

The dynamics of the electricity market in Europe in 2025
Primary electricity sources in Europe
Europe's electricity market is characterized by a diverse array of energy sources. The main source of electricity across the continent varies by region, reflecting different geographical and economic factors.
In many European countries, nuclear energy and natural gas are significant contributors to the electricity mix. Renewable sources like wind, solar, and hydroelectric power are also rapidly growing, reflecting the continent's commitment to sustainable energy.
Role of renewable energy
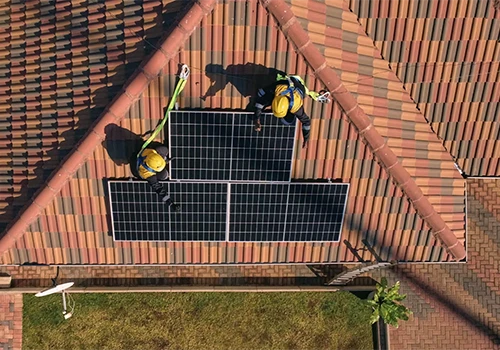
Renewable energy is increasingly prominent in Europe's energy landscape. Countries are investing in wind farms, solar panels, and hydroelectric plants to reduce carbon emissions and combat climate change.
This shift towards renewables is driven by both environmental policies and technological advancements. European nations are leading the way in developing and implementing green energy technologies.
Advancements in smart metering
Following EU regulations, a significant number of households in Europe have installed smart meters. These devices provide detailed information on electricity usage, measuring consumption on an hourly basis.
Smart meters enable consumers to adjust their energy use in response to real-time data. Many European households have electricity plans that are linked to the current spot price, allowing them to benefit from hourly price variations.
Interconnected European electricity market
Most European countries are part of a shared electricity market, which is facilitated by extensive interconnections between national grids. This integration allows for the efficient distribution of electricity across borders.
These connections enhance the reliability of the electricity supply and promote the use of renewable energy sources. They allow countries with excess renewable energy to export it to regions with higher demand, optimizing the use of green energy across the continent.
Challenges and opportunities in energy supply
Europe faces challenges in balancing its energy supply, particularly with the variable nature of renewable sources. Ensuring a stable and continuous supply of electricity is a key focus.
Investments in energy storage technologies and grid modernization are critical in addressing these challenges. These advancements will enable Europe to maximize the benefits of its diverse energy mix.
Today's electricity prices across Europe reveal significant variations. The highest price is found in 🇵🇱 Poland, with a cost of €0.135 per kWh. This surpasses rates in several other countries, including 🇭🇺 Hungary and 🇸🇰 Slovakia.
On the opposite end, 🇸🇪 Sweden (Mid-North) experiences the lowest electricity price at just €0.002 per kWh. Notably, 🇳🇴 Norway (North) and other Swedish regions also enjoy exceptionally low costs, demonstrating the wide-ranging electricity pricing landscape across Europe today.
| Price area – €/kWh | Avg. | High | Low | |
|---|---|---|---|---|
| #1 🇵🇱 Poland | +15,3% | 0.135 | 0.415 | 0.087 |
| #2 🇭🇺 Hungary | +28,2% | 0.122 | 0.341 | 0.081 |
| #3 🇸🇰 Slovakia | +17,6% | 0.118 | 0.307 | 0.079 |
| #4 🇮🇹 Italy (Sicily) | -5,4% | 0.117 | 0.154 | 0.098 |
| #5 🇮🇹 Italy (Centre-North) | +0,6% | 0.117 | 0.174 | 0.097 |
| #6 🇮🇹 Italy (Centre-South) | +0,6% | 0.117 | 0.174 | 0.097 |
| #7 🇮🇹 Italy (Sardinia) | +0,6% | 0.117 | 0.174 | 0.097 |
| #8 🇮🇹 Italy (South) | +0,6% | 0.117 | 0.174 | 0.097 |
| #9 🇮🇹 Italy (North) | +0,4% | 0.116 | 0.174 | 0.097 |
| #10 🇮🇹 Italy (Calabria) | -3,9% | 0.113 | 0.154 | 0.097 |
| #11 🇭🇷 Croatia | +24,0% | 0.113 | 0.284 | 0.073 |
| #12 🇦🇹 Austria | +4,3% | 0.111 | 0.188 | 0.080 |
| #13 🇸🇮 Slovenia | +20,2% | 0.111 | 0.255 | 0.076 |
| #14 🇨🇿 Czech Republic | +8,2% | 0.110 | 0.217 | 0.078 |
| #15 🇩🇪 Germany | -1,7% | 0.110 | 0.213 | 0.079 |
| #16 🇱🇺 Luxembourg | -1,7% | 0.110 | 0.213 | 0.079 |
| #17 🇷🇸 Serbia | +17,9% | 0.107 | 0.280 | 0.041 |
| #18 🇨🇭 Switzerland | +2,6% | 0.104 | 0.149 | 0.086 |
| #19 🇷🇴 Romania | +28,1% | 0.104 | 0.364 | 0.010 |
| #20 🇧🇬 Bulgaria | +34,3% | 0.104 | 0.364 | 0.010 |
| #21 🇬🇷 Greece | +36,1% | 0.104 | 0.364 | 0.010 |
| #22 🇩🇰 Denmark (West) | +147,4% | 0.103 | 0.172 | 0.074 |
| #23 🇩🇰 Denmark (East) | +8,5% | 0.103 | 0.172 | 0.074 |
| #24 🇳🇱 Netherlands | +11,9% | 0.103 | 0.172 | 0.065 |
| #25 🇧🇪 Belgium | +41,4% | 0.094 | 0.172 | 0.057 |
| #26 🇳🇴 Norway (South) | +5,5% | 0.075 | 0.092 | 0.065 |
| #27 🇸🇪 Sweden (South) | +92,5% | 0.061 | 0.148 | 0.005 |
| #28 🇱🇻 Latvia | +16,5% | 0.060 | 0.154 | 0.004 |
| #29 🇱🇹 Lithuania | +16,5% | 0.060 | 0.154 | 0.004 |
| #30 🇵🇹 Portugal | +51,4% | 0.052 | 0.105 | 0.000 |
| #31 🇪🇸 Spain | +49,3% | 0.052 | 0.105 | 0.000 |
| #32 🇳🇴 Norway (West) | +9,4% | 0.051 | 0.062 | 0.025 |
| #33 🇳🇴 Norway (East) | +2,0% | 0.050 | 0.071 | -0.019 |
| #34 🇪🇪 Estonia | +0,2% | 0.047 | 0.154 | 0.004 |
| #35 🇸🇪 Sweden (Mid-South) | +83,2% | 0.042 | 0.102 | 0.003 |
| #36 🇫🇷 France | +8,0% | 0.014 | 0.058 | 0.000 |
| #37 🇫🇮 Finland | +300,4% | 0.012 | 0.050 | 0.001 |
| #38 🇳🇴 Norway (Mid) | -0,9% | 0.010 | 0.017 | -0.001 |
| #39 🇸🇪 Sweden (North) | +116,3% | 0.005 | 0.010 | 0.001 |
| #40 🇳🇴 Norway (North) | +18,8% | 0.004 | 0.005 | 0.002 |
| #41 🇸🇪 Sweden (Mid-North) | +119,9% | 0.002 | 0.005 | 0.000 |