

Source: appropedia.org
Background
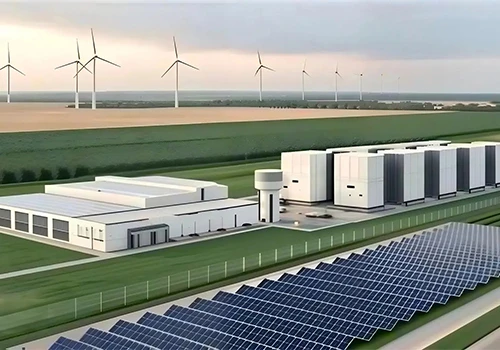
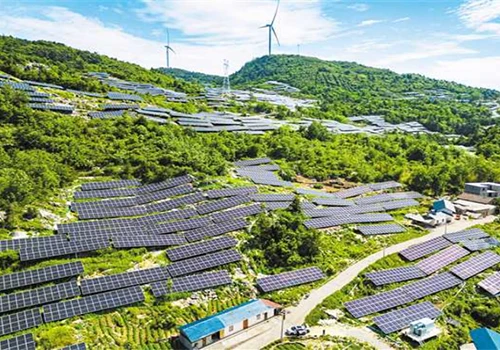
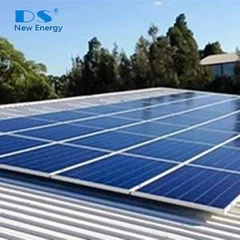
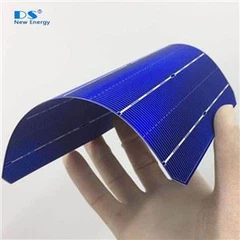
Alternative energy technologies such as photovoltaic modules (Figure 1) are becoming more popular around the world. In 2008, for the first time, worldwide investments in alternative energy sources drew more investors than fossil fuels, netting $155 billion in net capital against $110 billion of new investment in oil, natural gas and coal. Solar power alone generated $6.5 billion in worldwide revenue in 2004, and is expected to almost triple that with projected revenues of $18.5 billion for 2010.
Alternative energy technologies are becoming increasingly popular throughout the world due to greater awareness and concerns regarding pollution, and global climate change. Alternative energy technologies offer a new option for obtaining useful energy from sources that have less environmental impact on the planet. But how much less?
A previous published review of the net energy analysis of silicon-based photovoltaics [1] found that all types of silicon (amorphous, polycrystalline and single crystal)-based PV generated far more energy over their lifetime than is used in their production. All modern silicon PV pay for themselves in terms of energy in less than 5 years - even in highly suboptimal deployment scenarios.
This article explores all of the environmental impacts associated with the production and lifetime use of silicon photovoltaic (PV) panels.
What is a Life Cycle Assessment (LCA)
A Life Cycle Assessment (LCA) evaluates the environmental impacts of a product or process from production to disposal [2]. An LCA investigates the material and energy inputs required to produce and use a product, the emissions associated with its use, and the environmental impacts of disposal or recycling. The LCA may also investigate external costs, such as environmental mitigation, that are made necessary by the production or use of a product [3].
Brief History of Solar Power
The first photovoltaic cell was built by Charles Fritts, who built a 30-cm cell from selenium and gold in 1883 [4]. Modern silicon photovoltaic technology was discovered in 1954 by researchers in Bell Labs, who accidentally developed the pn-junction that enables photovoltaics to produce useful electricity [5]. In 1958, NASA began using photovoltaics as backup power systems for its satellites [4]The first solar-powered residence was constructed at the University of Delaware in 1973, and the first megawatt-scale photovoltaic project was installed in California in 1984 [4].
Silicon PV Panel Lifecycle Analysis
The following section contains a brief lifecycle analysis of silicon PV panels. The lifecycle factors discussed include: the energy required for production, the lifecycle carbon dioxide emissions, and all of the pollution emissions generated throughout a PV panels useful life from: transportation, installation, operation, and disposal.
Energy Requirements for Production
Manufacturing photovoltaics is overwhelmingly the most energy intensive step of installed PV modules. As seen in Figure 2, large amounts of energy are used to convert silica sand into the high purity silicon required for photovoltaic wafers. The assembling of the PV modules is another resource intensive step with the addition of high energy content aluminum framing and glass roofing.

Figure 2: Energy requirements of production stages in the manufacturing of PV panels as percentages of the Gross Energy Requirement (GER) of 1494 MJ/panel (~ 0.65m2 surface)[6].
The environmental impact of a silicon photovoltaic module involves the production of three main components: the frame, the module, and balance-of-system components such as the rack and inverter [3]. Greenhouse gases are caused mostly by module production (81%), followed by the balance of system (12%) and frame (7%)[3]). Resource requirements of the production cycle are summarized in Figure 3.

Figure 3: The production cycle and required resources of a silicon module [6].
Lifecyle Carbon Dioxide Emissions
Lifecycle carbon dioxide emissions refer to the emissions caused by the production, transportation, or installation of materials related to photovoltaic systems. In addition to the modules themselves, the typical installation includes electrical cable and a metal rack. Ground-mounted photovoltaic systems also include a concrete foundation. Remote installations may require additional infrastructure for transmission of electricity to the local electrical grid. In addition to materials, a life cycle analysis should include carbon dioxide emitted from vehicles during the transportation of photovoltaic modules between the factory, the warehouse, and the installation site. Figure 4 compares the relative contributions of these factors to the lifetime carbon dioxide impacts of five types of photovoltaic modules [7].

Figure 4: Lifetime carbon dioxide emissions for large-scale photovoltaic installations, categorized according to component. This graph compares typical monocrystalline silicon modules (m-Si(a)), high-efficiency monocrystalline silicon (m-Si(b)), cadmium tellurium (CdTe), and copper indium selenium (CIS) modules. Graph by authors, based on [7].
Transportation Emissions
Transportation accounts for about 9% of lifecycle emissions of photovoltaics [7]. Photovoltaic modules, racks, and balance-of-system hardware (such as cables, connectors, and mounting brackets) are frequently produced overseas and transported to the United States by ship [8].Within the United States, these components are transported by truck to distribution centers and eventually to the installation site.
Installation Emissions
Emissions associated with installation include vehicle emissions, material consumption, and electricity consumption associated with local construction activities to install the system. These activities generate less than 1% of total lifecycle emissions of the photovoltaic system [8].
Operation Emissions
There are no air or water emissions generated during the use of PV modules. Airsheds are impacted during the construction of PV modules from solvent and alcohol emissions that contribute to photochemical ozone formation. Watersheds are impacted by the construction of modules from extraction of natural resources such as quartz, silicon carbide, glass, and aluminum. Overall, replacement of current worldwide grid electricity with central PV systems would lead to 89-98% reductions in greenhouse gas emissions, criteria pollutants, heavy metals, and radioactive species [9].
Disposal Emissions
The disposal of silicon photovoltaic modules has not caused significant impacts because large-scale installations have only been in use since the mid-1980's and photovoltaic modules have lifetimes of at least 30 years [4]. Fthenakis et al. (2005)[2] specifically identified a lack of available data on the disposal or recycling of photovoltaic modules, so this topic warrants more thorough investigation.
LCA of Photovoltaics Compared to Other Energy Sources
Total lifecycle emissions associated with photovoltaic energy production are higher than those of nuclear power but lower than those of fossil fuel energy production. Lifecycle greenhouse gas emissions of several energy generation technologies are listed below: [3].
Silicon PV: 45 g/kWh
Coal: 900 g/kWh
Natural gas: 400-439 g/kWh
Nuclear: 20-40 g/kWh
During their 20-30 year lifetimes, solar modules generate more electricity than was consumed during their production. The energy payback time quantifies the minimum useful life required for a solar module to generate the energy that was used to produce the module. As shown in Table 1, the average energy payback time is 3-6 years.
Table 1: Energy Pay Back Times (EPBT) and Energy Return Factors (ERF) of PV modules installed in various locations around the world[6].
Country | Town | Solar Radiation | Latitude | Altitude | Annual Production | EPBT | ERF |
(kWh/m2) | (m) | (kWh/kWp) | (years) | ||||
Australia | Sydney | 1614 | 33.55 | 1 | 1319 | 3.728 | 7.5 |
Austria | Vienna | 1108 | 48.2 | 186 | 906 | 5.428 | 5.2 |
Belgium | Brussels | 946 | 50.5 | 77 | 788 | 6.241 | 4.5 |
Canada | Ottawa | 1377 | 45.25 | 75 | 1188 | 4.14 | 6.8 |
Czech Republic | Prague | 1000 | 50.06 | 261 | 818 | 6.012 | 4.7 |
Denmark | Copenhagen | 985 | 55.75 | 1 | 850 | 5.786 | 4.8 |
Finland | Helsinki | 956 | 60.13 | 0 | 825 | 5.961 | 4.7 |
France | Paris | 1057 | 48.52 | 32 | 872 | 5.64 | 5 |
France | Marseille | 1540 | 43.18 | 7 | 1317 | 3.734 | 7.5 |
Germany | Berlin | 999 | 52.32 | 35 | 839 | 5.862 | 4.8 |
Germany | Munich | 1143 | 48.21 | 515 | 960 | 5.123 | 5.5 |
Greece | Athens | 1563 | 38 | 139 | 1278 | 3.848 | 7.3 |
Hungary | Budapest | 1198 | 47.3 | 103 | 988 | 4.978 | 5.6 |
Ireland | Dublin | 948 | 53.2 | 9 | 811 | 6.064 | 4.6 |
Italy | Rome | 1552 | 41.53 | 15 | 1315 | 3.74 | 7.5 |
Italy | Milan | 1251 | 45.28 | 103 | 1032 | 4.765 | 5.9 |
Japan | Tokyo | 1168 | 35.4 | 14 | 955 | 5.15 | 5.4 |
Republic of Korea | Seoul | 1215 | 37.3 | 30 | 1002 | 4.908 | 5.7 |
Luxembourg | Luxembourg | 1035 | 49.62 | 295 | 862 | 5.705 | 4.9 |
The Netherlands | Amsterdam | 1045 | 52.21 | 1 | 886 | 5.551 | 5 |
New Zeland | Wellington | 1412 | 41.17 | 21 | 1175 | 4.185 | 6.7 |
Norway | Oslo | 967 | 59.56 | 13 | 870 | 5.653 | 5 |
Portugal | Lisbon | 1682 | 35.44 | 16 | 1388 | 3.543 | 7.9 |
Spain | Madrid | 1660 | 40.25 | 589 | 1394 | 3.528 | 7.9 |
Spain | Sevilla | 1754 | 37.24 | 5 | 1460 | 3.368 | 8.3 |
Sweden | Stockholm | 980 | 59.21 | 16 | 860 | 5.718 | 4.9 |
Switzerland | Bern | 1117 | 46.57 | 524 | 922 | 5.334 | 5.2 |
Turkey | Ankara | 1697 | 39.55 | 1102 | 1400 | 3.513 | 8 |
United Kingdom | London | 955 | 51.3 | 20 | 788 | 6.241 | 4.5 |
United Kingdom | Edinburgh | 890 | 55.57 | 32 | 754 | 6.522 | 4.3 |
United States | Washington | 1487 | 38.52 | 14 | 1249 | 3.937 | 7.1 |
Conclusions
Silicon PV panels have a low life cycle environmental impact compared to most conventional forms of energy such as coal and natural gas. The greatest carbon emissions caused by the use of PV panels are those associated with module production. Energy Pay Back Times (EPBT) vary between 3 and 6 years for various solar climates around the world. Overall, silicon PV panels payback the required upfront energy costs of production well before their useful lifetime and are a net energy generators for the majority of their useful life.
References
1 J. Pearce and A. Lau, "Net Energy Analysis For Sustainable Energy Production From Silicon Based Solar Cells", Proceedings of American Society of Mechanical Engineers Solar 2002: Sunrise on the Reliable Energy Economy, editor R. Cambell-Howe, 2002.pdf
4 Luque, A., and S. Hegedus (2003), Handbook of Photovoltaic Science and Engineering, Wiley, Hoboken, NJ.
5 Goetzberger, A., and V. U. Hoffmann (2005), Photovoltaic Solar Energy Generation, Springer, New York, NY.
6 Life cycle assessment of photovoltaic electricity generation, A. Stoppato, Energy, Volume 33, Issue 2, February 2008, Pages 224-232
7 Ito, M., K. Kato, K. Komoto, T. Kichimi, and K. Kurokawa (2007), A comparative study on cost and life-cycle analysis for 100 MW very large-scale PV (VLS-PV) systems in deserts using m-Si, a-Si, CdTe, and CIS modules, Progress in Photovoltaics, 16, 17-30
8 Ito, M., K. Kato, K. Komoto, T. Kichimi, and K. Kurokawa (2007), A comparative study on cost and life-cycle analysis for 100 MW very large-scale PV (VLS-PV) systems in deserts using m-Si, a-Si, CdTe, and CIS modules, Progress in Photovoltaics, 16, 17-30
9 Fthenakis, V., Kim, H., and E. Alsema (2008), Emissions from Photovoltaics Life Cycles. Environmental Science Technology, 42, 2168-2174.