What is Energy Payback Time
The Energy Payback Time or EPBT of a solar PV system is the amount of time it takes for an energy system to generate the amount of energy equivalent to the amount that took to produce the PV system.
For example, an 11 kW solar plant that produces 22.8MWh per year with a lifetime total of 570MWh, , uses is 48.83 MWh to do so. To find the EPBT:

It will take 2.14 years for the solar power system to produce the same amount of energy that was used to assemble it.
Factors that influence energy payback time
The energy payback time is influenced by the following three factors:
The materials used in the system
The solar cell efficiency
The location and related irradiation
1. Energy payback time and materials used
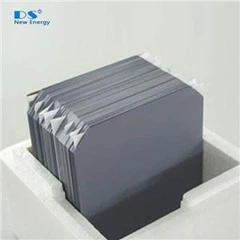
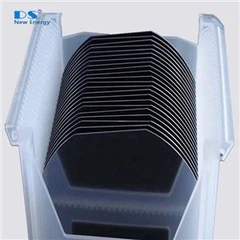
Over the past years, manufacturers of silicon wafers have been able to reduce the thickness of the wafer and therefore reduce the costs of the solar cell significantly. One enabler for thinner wafers are the automatic soldering machines, which put a lot less pressure on solar cells than manual soldering. Below you can see that over the past decade, wafer thicknesses have been reduced from 300µm in 2004 to 180µm in 2014. Fraunhofer collected the thickness of the wafer and the silicon usage in gram/Wp in one simple table, great overview:

2. Energy payback time and solar cell efficiency
When solar cell efficiency increases, more power is generated with the same amount of materials. Below you can see the clear trend in NREL's Best Cell Efficiencies':

3. Energy payback time and related irradiation
As you can see from the handy Fraunhofer over 'Energy Pay-Back Time of Multicrystalline Silicon PV Rooftop Systems' below, the energy payback time in Europe varies between approximately 1 and 2.5 years. The energy payback time in Northern Europe is 2.1 years compared to 1.2 years in Southern Europe.

Data: Lorenz Friedrich, Fraunhofer ISE. Image: JRC European Commission. Graph: PSE 2020 (Modified scale with updated data from Fraunhofer ISE)

